Power BI custom visuals · for manufacturing

Turn production data into decisions.

Two premium Power BI visuals built for the shop floor — plan weekly production across every area, and track machine OEE, targets and downtime in real time. No DAX required.

AppSource-ready Dark & light themes No external data calls EN · HU · DE
Two visuals, one platform

Built to be bought together — or on their own

Each visual works standalone on a simple star schema. Use one, or pair them for end-to-end plan-vs-actual visibility.

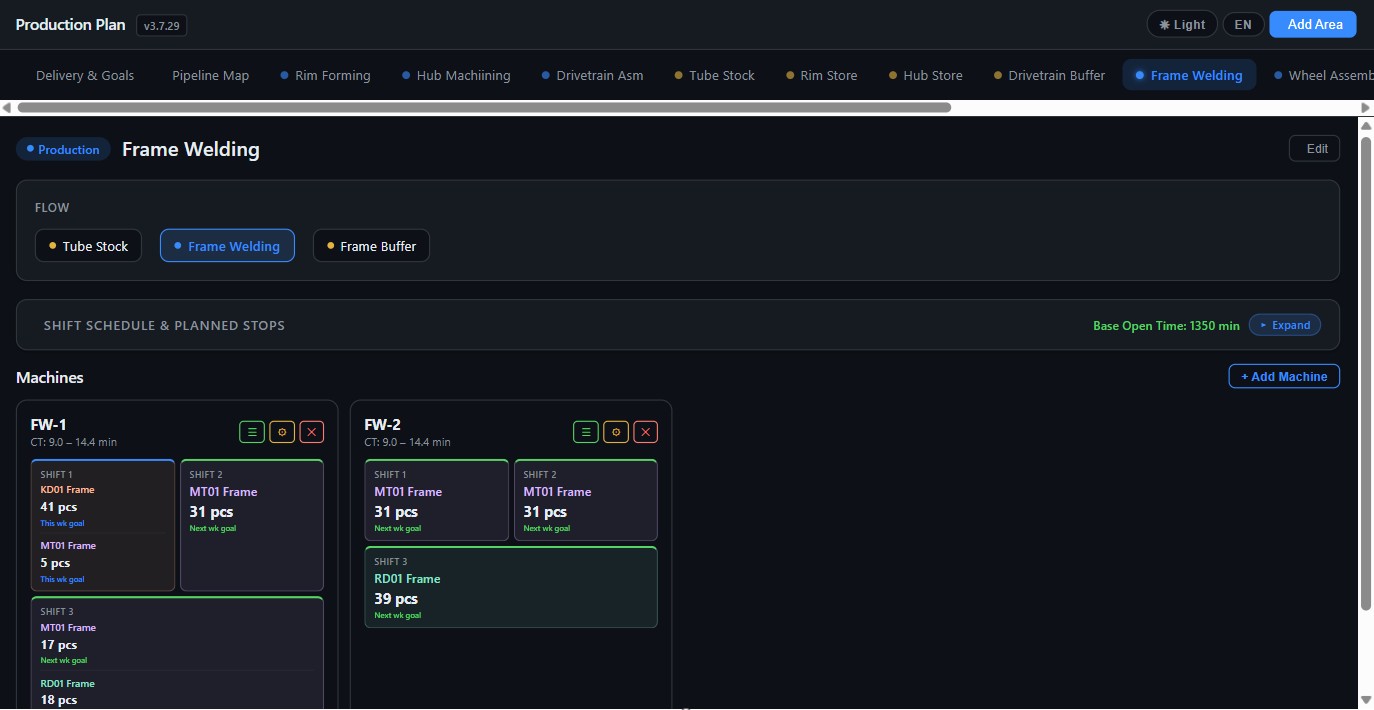
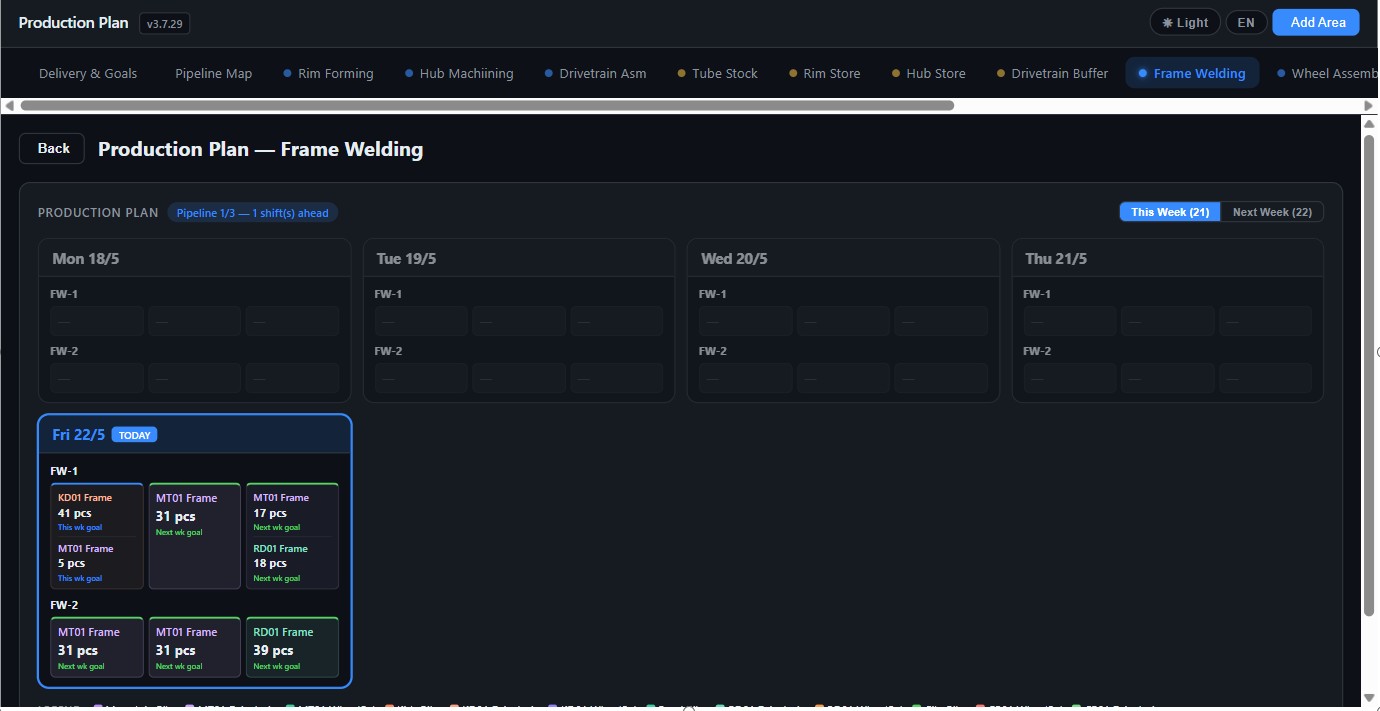
Production Plan schedule
Production Plan

Weekly production scheduler

Capacity-aware, shift-by-shift planning across multi-stage manufacturing, with a live pipeline map.

  • Production / quality / buffer areas & machines
  • Pull-through demand with BOM explosion
  • Buffer tracking & supply-risk warnings
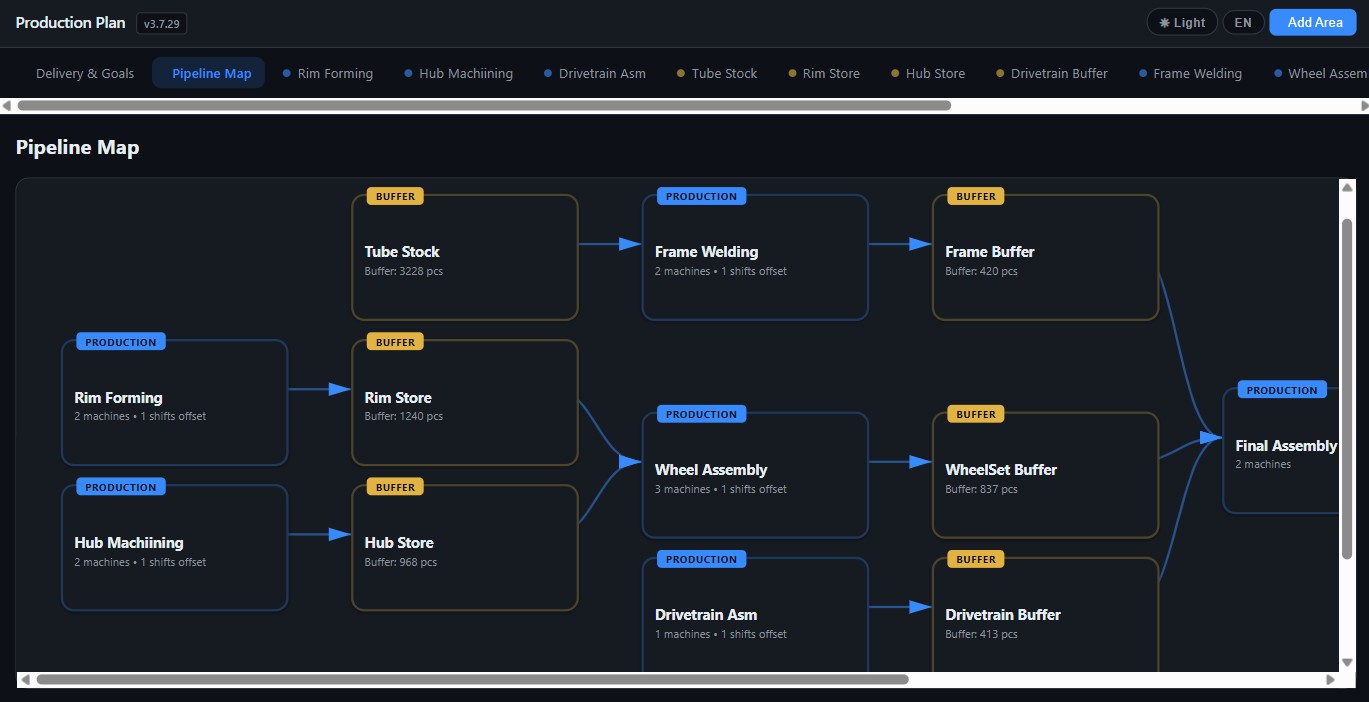
  • Pipeline map with hover highlighting
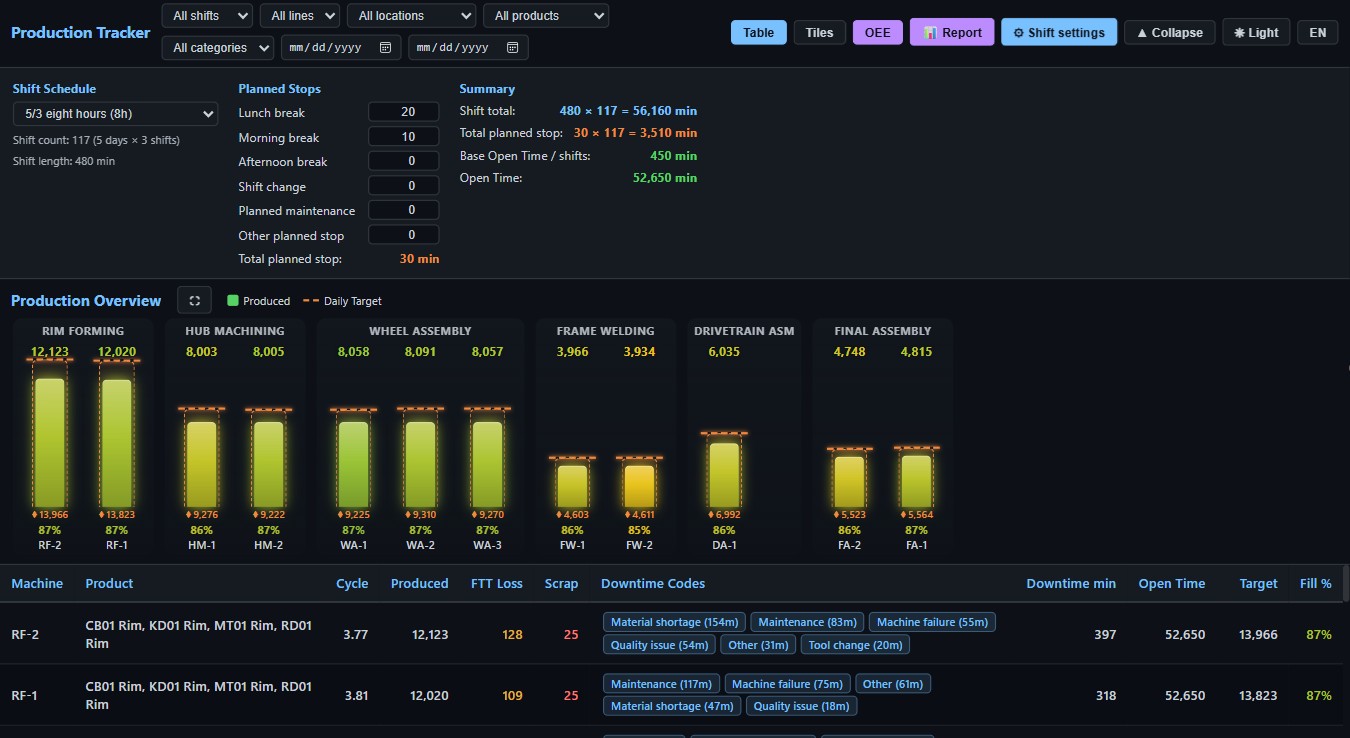
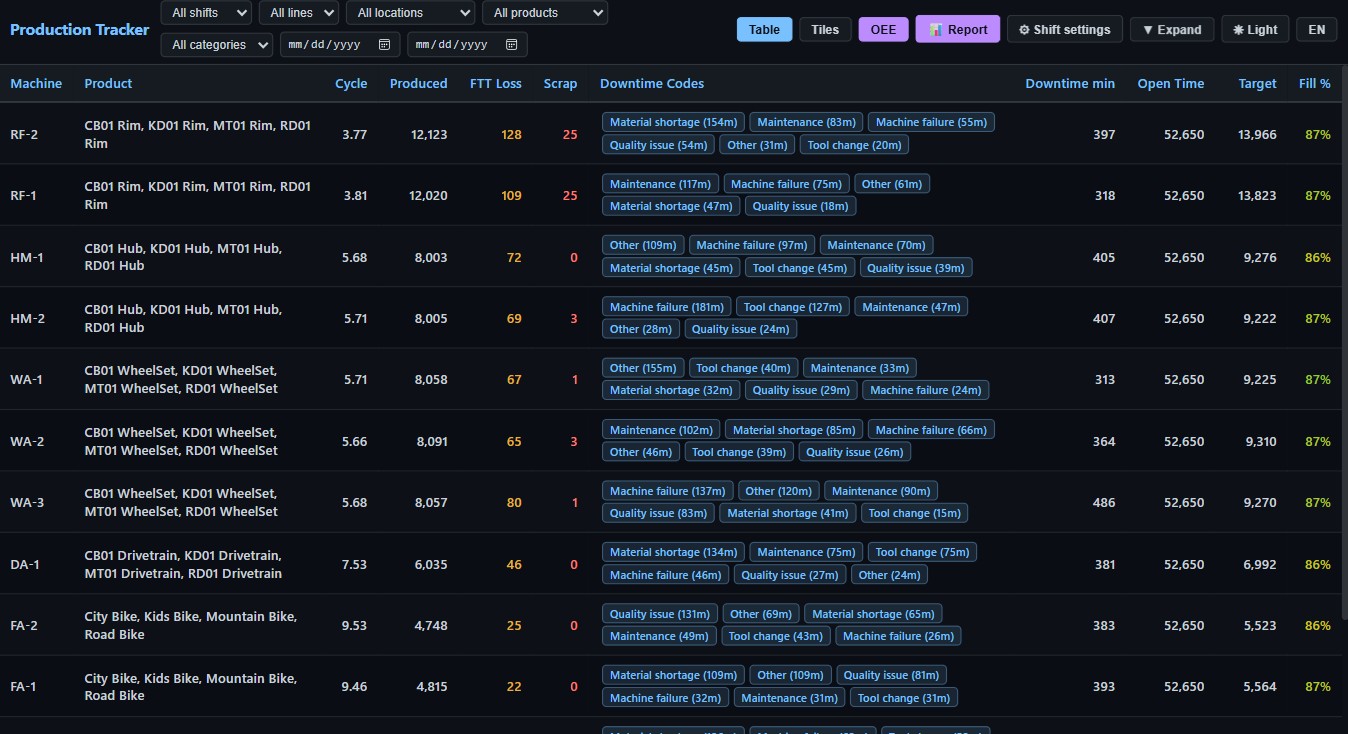
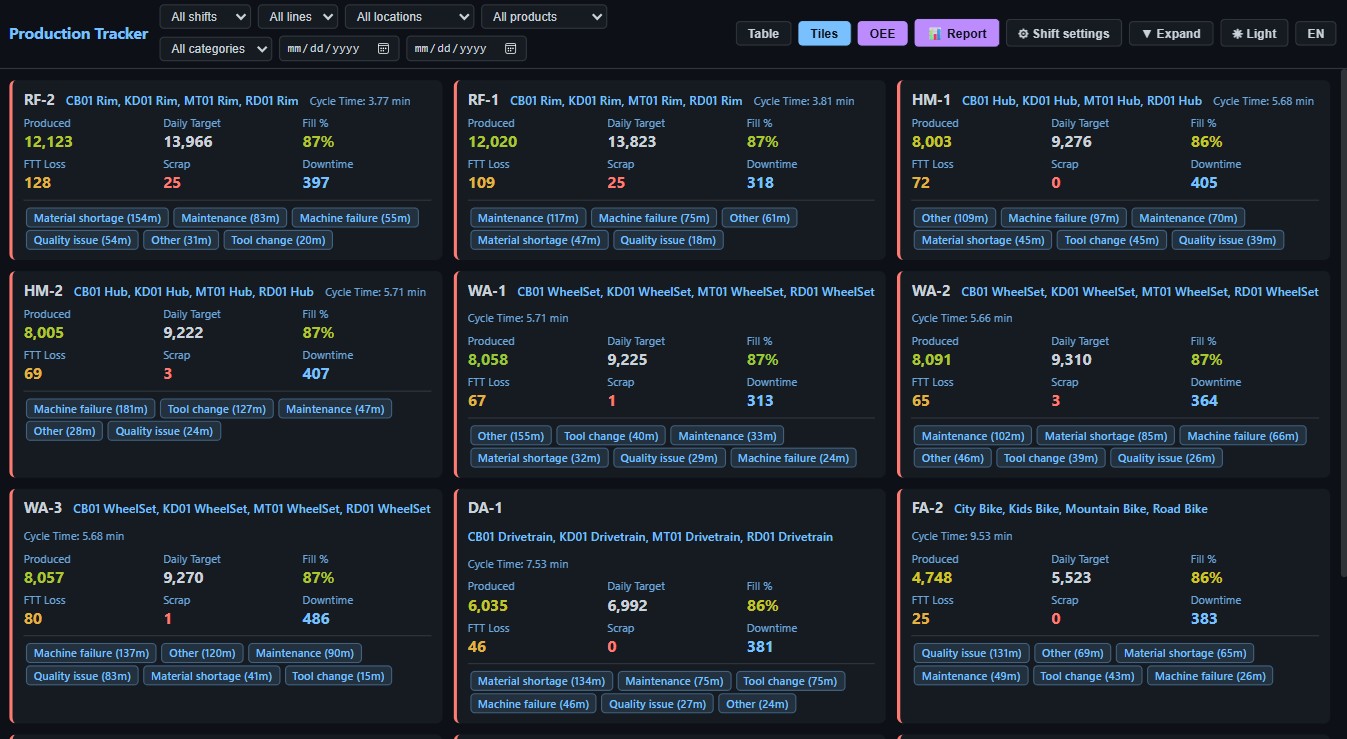
Production Tracker overview
Production Tracker

OEE & downtime dashboard

Per-machine production overview with OEE, daily-target fulfilment and planned vs. unplanned downtime.

  • Four views: chart, table, tiles, OEE gauges
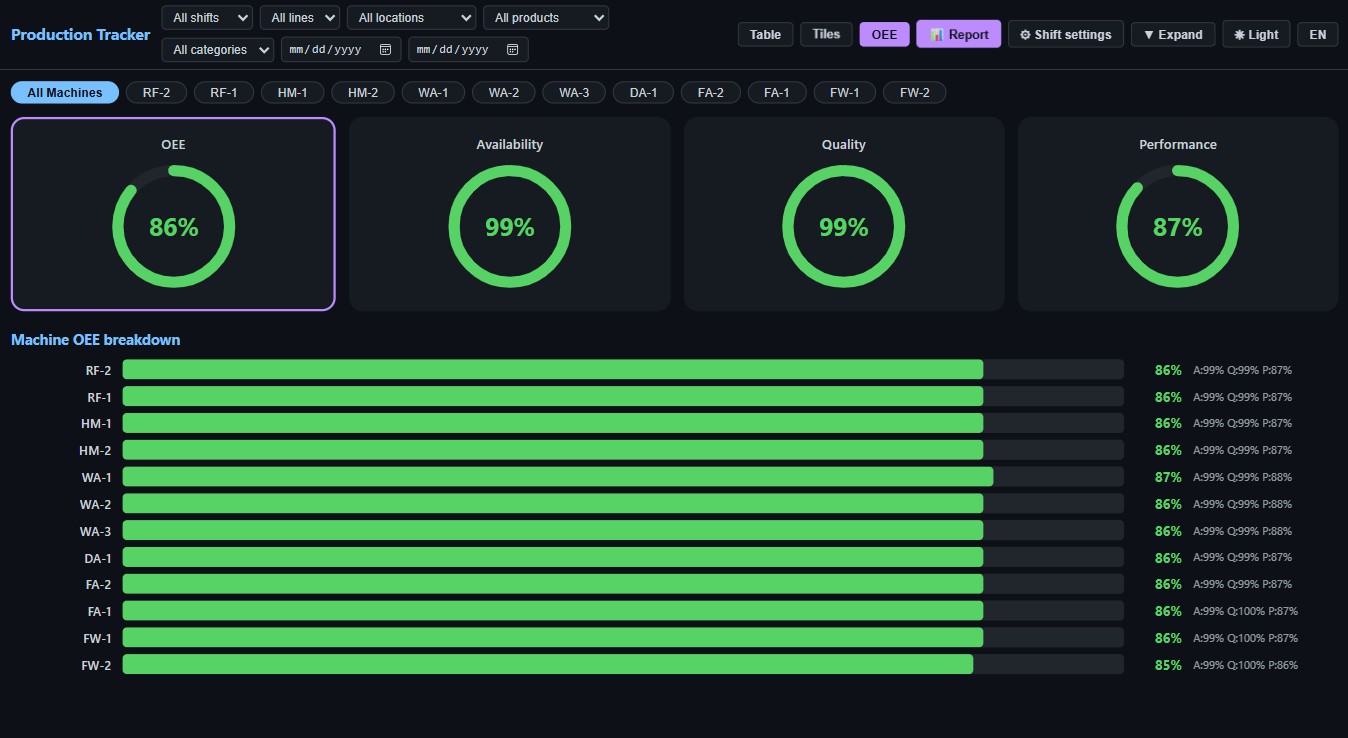
  • Automatic OEE from a configurable shift schedule
  • Planned / unplanned downtime split
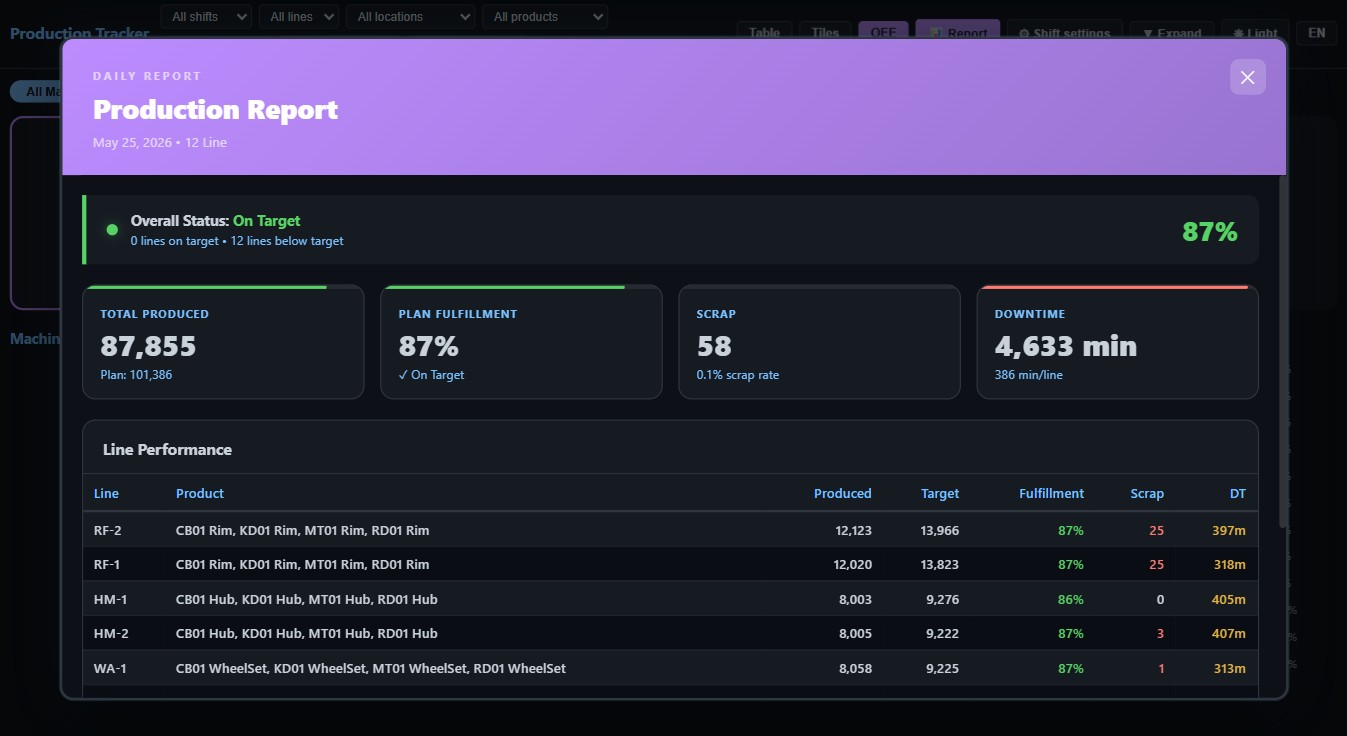
  • Printable daily report
Complex capability. Simple setup.

Powerful visuals — without the complexity

These visuals do a lot — OEE, scheduling, downtime, pipeline maps. Getting them running does not. There are no measures and no DAX to write — you simply drag your columns onto the right fields and the visual does the rest.

1

Install from AppSource

Add the visual to your report in one click — no admin scripts, no dependencies.

2

Bind your columns

Drop your existing columns onto the fields — Machine, Produced, Cycle Time… The field tooltips tell you exactly what to bind. No DAX, no measures.

3

You're live

OEE, targets, downtime and the schedule are calculated automatically. Switch theme, language and views as you like.

🛡️

Your data never leaves Power BI

All processing happens locally inside your report. The visuals make no external network calls, send no telemetry, and store nothing outside your Power BI tenant — secure by design.

No external data calls No telemetry or tracking Processed locally in your report No DAX measures required
See them in action

A closer look

Every view of both visuals — drag, swipe, or let it rotate.

Production Tracker overview
Production Tracker — overview
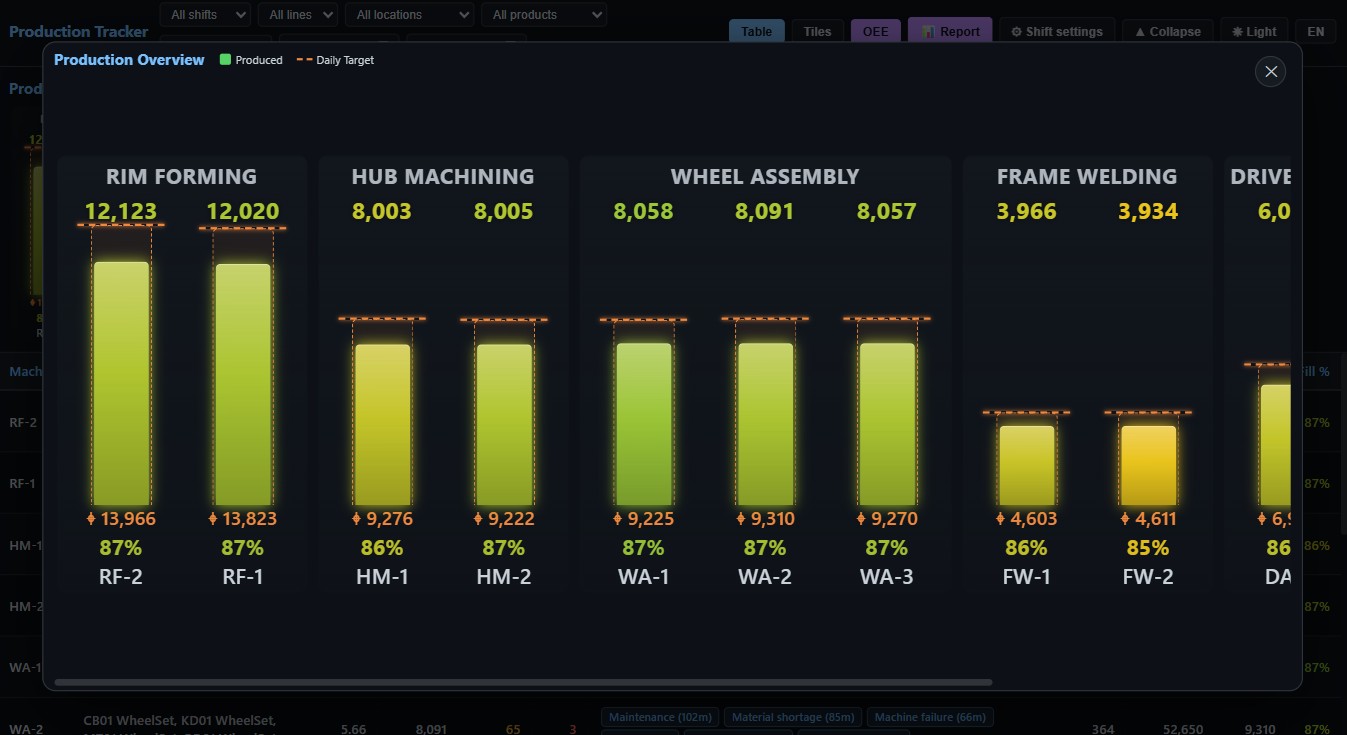
Production overview chart
OEE gauges
OEE gauges
Daily report
Daily production report
Table view
Table view
Tiles view
Tiles view
Production Plan schedule
Production Plan — schedule
Pipeline map
Pipeline map
Production area setup
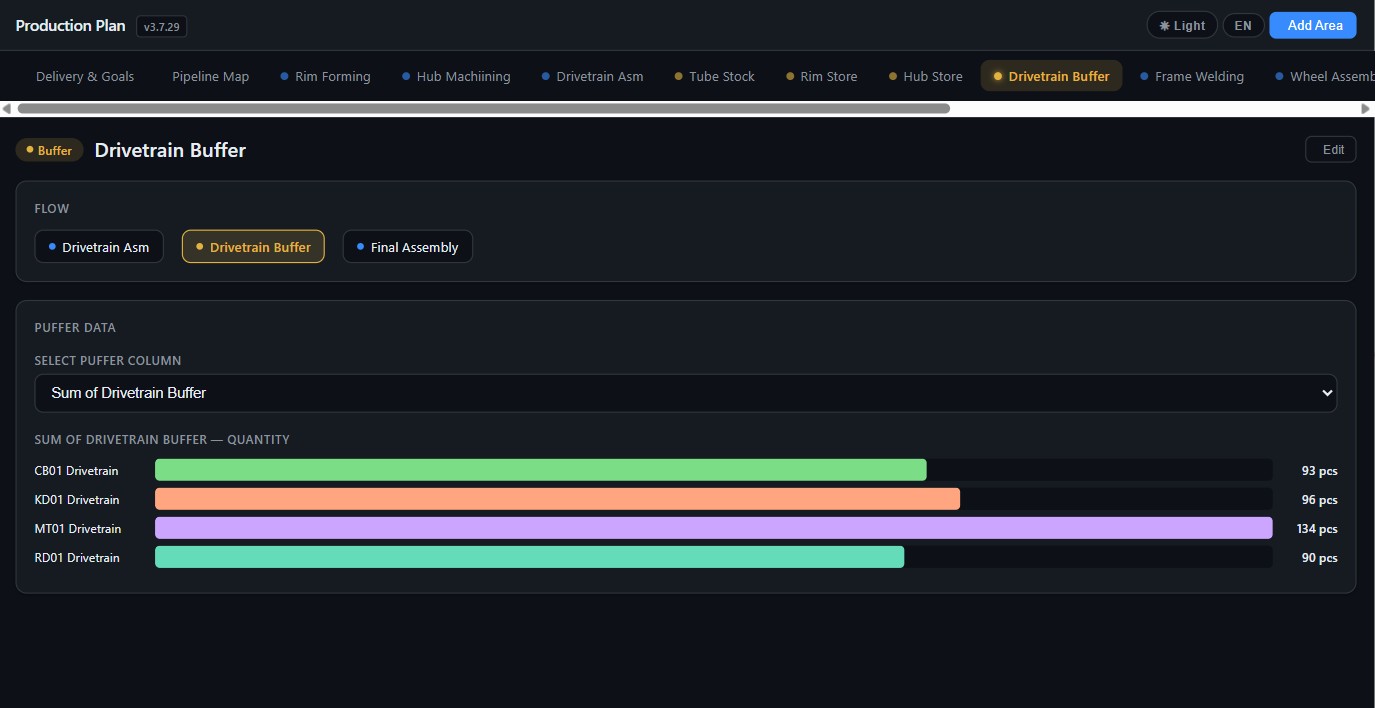
Buffer levels
Buffer (Puffer) levels
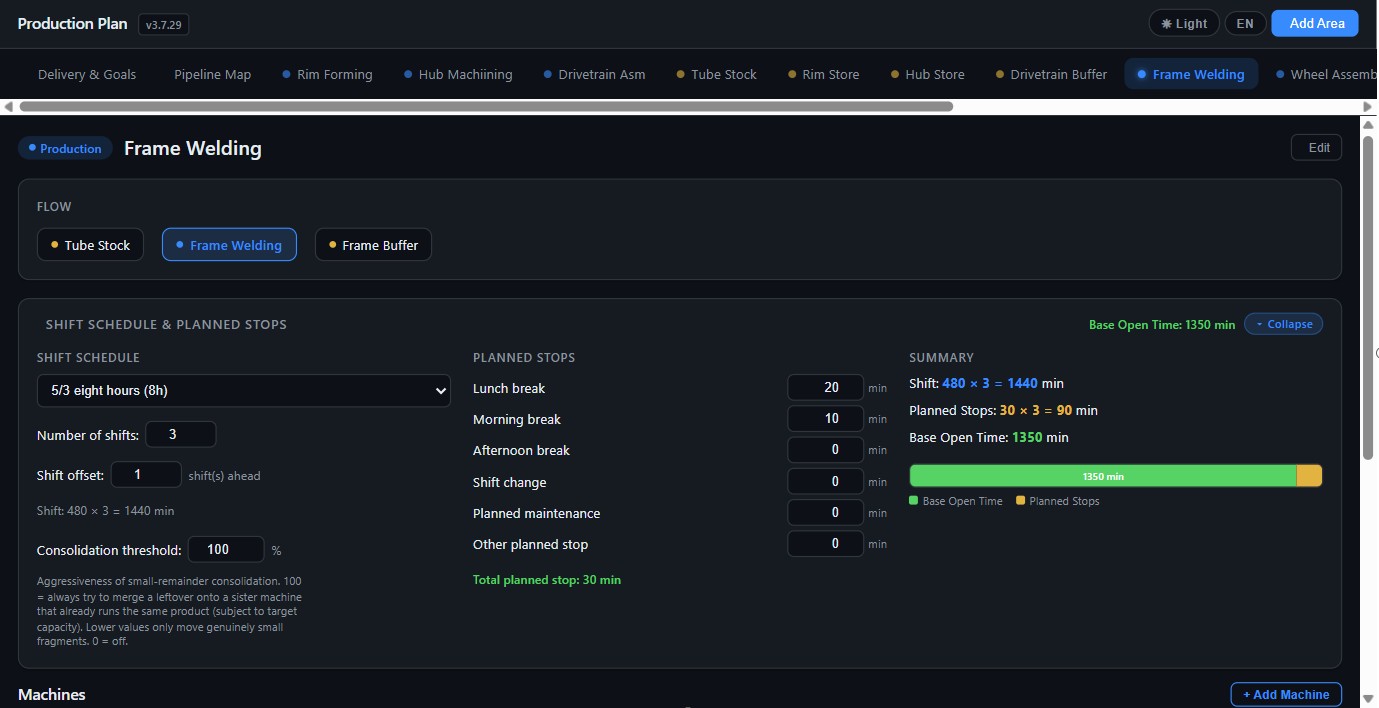
Shift schedule setup
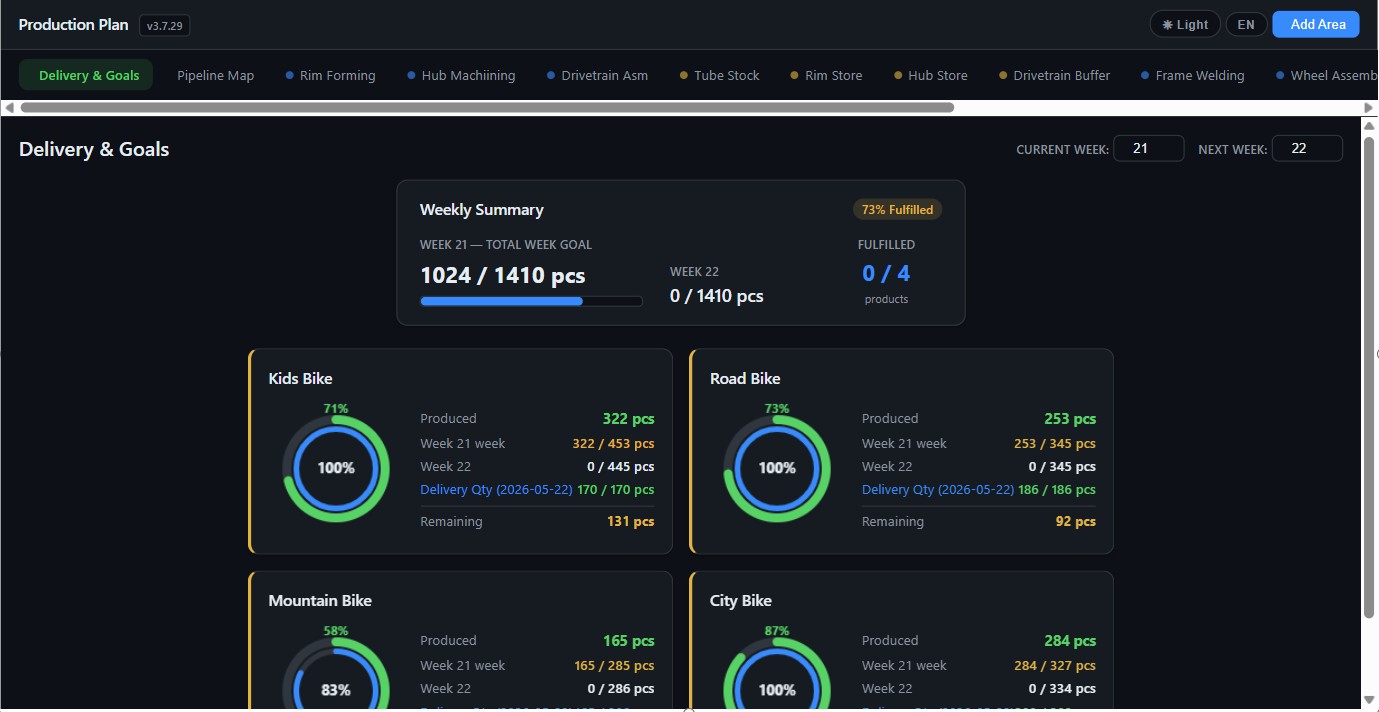
Goals and deliveries
Goals & deliveries
Why these visuals

Everything the shop floor needs

📊

OEE, done for you

Availability × Performance × Quality computed from your data and a shift schedule — no DAX measures to write.

⏱️

Downtime intelligence

Planned vs. unplanned downtime split automatically from a downtime code, with a clear per-machine breakdown.

🏭

Capacity-aware planning

Schedule production shift-by-shift across areas, respecting cycle times, planned stops and buffers.

🗺️

Pipeline map

See the whole material flow — areas and buffers as connected nodes with hover highlighting.

🎨

Dark & light themes

A polished, accessible design that matches your report — switchable in one click and saved with the report.

🔒

Private by design

No external network calls, no telemetry. Everything is processed locally inside your Power BI report.

Watch & learn

Tutorials

Short, practical videos for installation and everyday use — from binding your first column to reading the daily report.

Installation tutorial Coming soon
Getting started

Installing the visual

Add the visual from AppSource and drop it on your report.

Binding data tutorial Coming soon
Getting started

Binding your columns

Map your model to the fields — no DAX, no measures.

OEE and shift setup tutorial Coming soon
Production Tracker

OEE & shift schedule

Configure shifts and planned stops, and read the OEE gauges.

Daily report tutorial Coming soon
Production Tracker

The daily report

Generate and read the per-line daily production report.

Planning tutorial Coming soon
Production Plan

Areas & pipeline map

Set up production areas and visualise the material flow.

Goals and deliveries tutorial Coming soon
Production Plan

Goals, deliveries & buffers

Drive the plan with weekly goals, deliveries and buffer levels.

🎬 Video tutorials are on the way — check back soon, or ask us for a walkthrough in the meantime.

We've got you

Support

When you report an issue

  • 1

    Visual & version

    Tell us which visual and version you're using.

  • 2

    Environment

    Power BI Desktop version, or Power BI Service.

  • 3

    Expected vs. actual

    What you expected to happen, and what actually happened.

  • 4

    Bindings & screenshot

    The fields you bound and, if possible, a screenshot.

Response & scope

We aim to respond within 2 business days (Mon–Fri, CET).

Support covers installing, binding and configuring the visuals, the recommended data model, and bug reports.

Contact support Full support page
Let's talk

Get in touch

Questions, demos, volume licensing or custom work — drop us a line.

info@productionvisual.com 🏢 Query Craft Academy 🌍 Microsoft AppSource publisher