
Every company runs on decisions — which product to push, where to cut cost, which machine to fix first, when to hire. And every good decision runs on one thing: information. The companies that pull ahead aren't the ones sitting on the most data; they're the ones that turn data into clear, timely decisions.
In this post we look at why information is the real engine behind business decisions, and why data visualization — with tools like Microsoft Power BI — is what turns raw numbers into action.
Data is only valuable when it becomes a decision
Most organizations are already drowning in data: ERP systems, spreadsheets, CRM records, machine logs, finance exports. But data sitting in a database changes nothing on its own. Value is created at a single moment — when data becomes a decision.
A KPI nobody looks at has zero impact. A report that takes three days to build is a report that arrives after the decision was already made on gut feel. So the goal was never "collect more data." The goal is faster, more confident decisions — and that means getting the right information to the right person at the moment they need it.
The hidden cost of deciding in the dark
When teams can't see what's actually happening, they fall back on the loudest voice in the room, last quarter's assumptions, or a hunch. Sometimes they're right. Often the cost is quiet but real:
- Slow reactions — a problem is spotted days late, when it has already become expensive.
- Misallocated effort — energy goes to the issue that's loudest, not the one that matters most.
- No shared truth — two departments argue from two different spreadsheets, and the meeting becomes about whose number is right.
- Missed targets — by the time the monthly report lands, the month is over.
Bad or late information doesn't just cost one decision — it compounds. Every choice built on a shaky number tilts the next one a little further off course.
Why visualization is the bridge from data to decision
Here's the part that's easy to underestimate: humans are not built to read tables. We are built to read pictures. The brain processes a well-designed chart in a fraction of the time it takes to scan rows of numbers, and it spots patterns — a spike, a dip, an outlier — almost instantly.
That's what good data visualization does. It does three things a spreadsheet can't:
- It surfaces what matters — the one number that's off, highlighted, instead of buried in 10,000 cells.
- It reveals the story — trends, seasonality and exceptions become obvious at a glance.
- It creates shared understanding — everyone looks at the same picture and reaches the same conclusion, fast.
A spreadsheet hides the story in the data. A good visual tells it.
Power BI: turning company data into shared understanding
This is exactly where Microsoft Power BI earns its place. Power BI connects to the data you already have — databases, Excel, cloud services, line-of-business systems — and turns it into interactive dashboards that anyone in the company can read, filter and act on.
Instead of a static report emailed once a month, you get a live, single source of truth. A manager can slice it by region, a controller by cost center, an operator by machine — all from the same model, all current. That shift, from "request a report and wait" to "see the answer and decide," is the heart of a data-driven culture.
And because Power BI is extensible with custom visuals, it can be tailored to the way a specific industry actually makes decisions — not just generic bar charts, but views built around the real questions a team asks every day.
On the shop floor: where data turns straight into decisions
Nowhere is the link between information and decision more direct than in manufacturing. A production manager doesn't need a 40-page report — they need to see, in seconds, which machine is behind target, where downtime is piling up, and whether the week's plan is still realistic. With that picture in front of them, the decision makes itself.
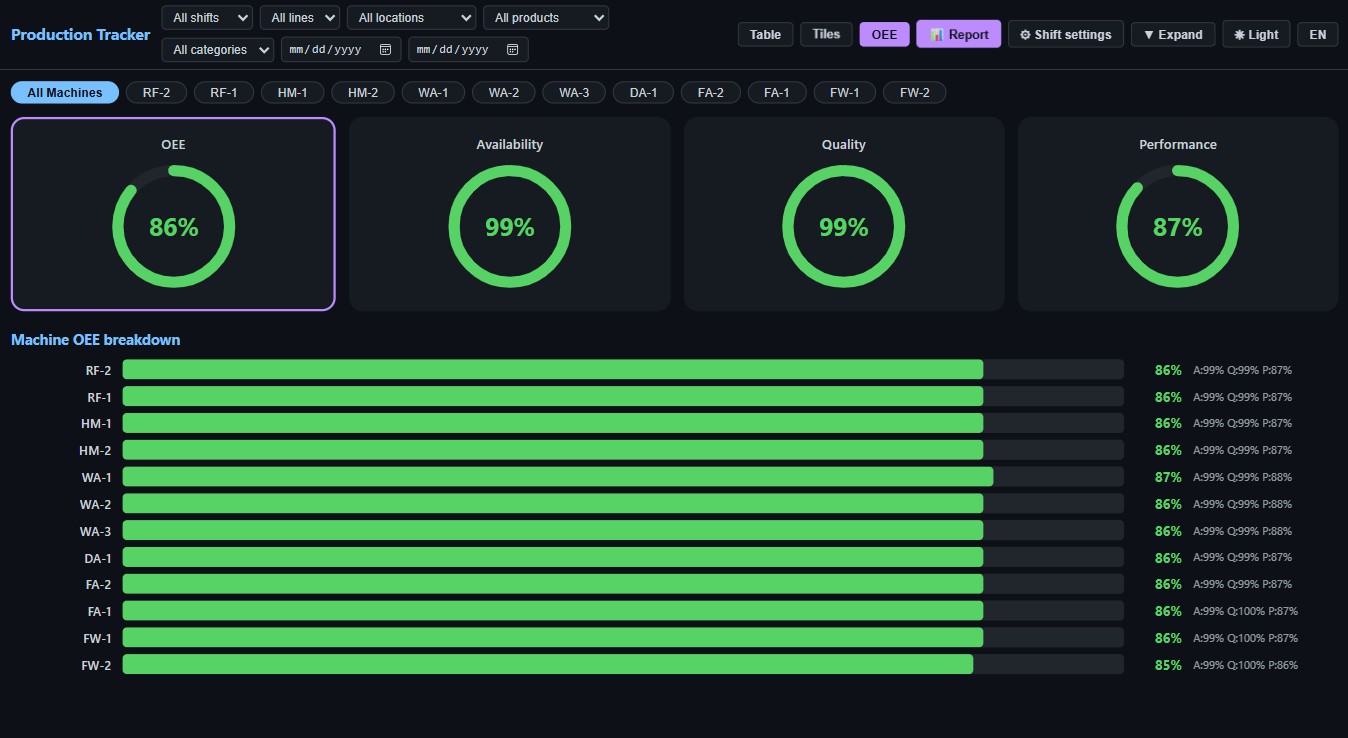
That's precisely why we built our Power BI custom visuals for manufacturing. Production Tracker turns raw production data into per-machine OEE, daily-target fulfilment and planned-vs-unplanned downtime — no DAX required. Production Plan does the same for the week ahead, with capacity-aware scheduling and a live material-flow map. Both follow the same principle this whole article is about: take the data the factory already produces, and make the decision obvious.
Building a data-driven culture (where to start)
You don't need a data science team or a six-month project to start. The most data-driven companies usually begin small and iterate:
- Start with one decision. Pick a question your team keeps answering by gut — "are we on target this week?" — and build the view that answers it.
- Agree on one source of truth. One dataset, one definition of each metric. Half the arguments disappear when the number is shared.
- Make it visual and make it live. A dashboard people actually open beats a perfect report nobody reads.
- Review on a rhythm. Put the dashboard on the wall, in the stand-up, in the Monday meeting — so decisions get made with it, not around it.
- Iterate. Add the next question, the next metric. A data culture grows one decision at a time.
The bottom line
Information is the raw material of every decision your company makes. Visualization is what turns that raw material into speed and confidence — and a platform like Power BI puts it in everyone's hands. The companies that win the next decade won't be the ones with the biggest databases. They'll be the ones that see clearly and decide fast.